Health metrics & readings
What this is for: tracking numbers about a patient over time — weight, blood pressure, blood sugar, anything your clinic measures — and seeing the trend instead of flipping through old notes.
One-time setup (admins)
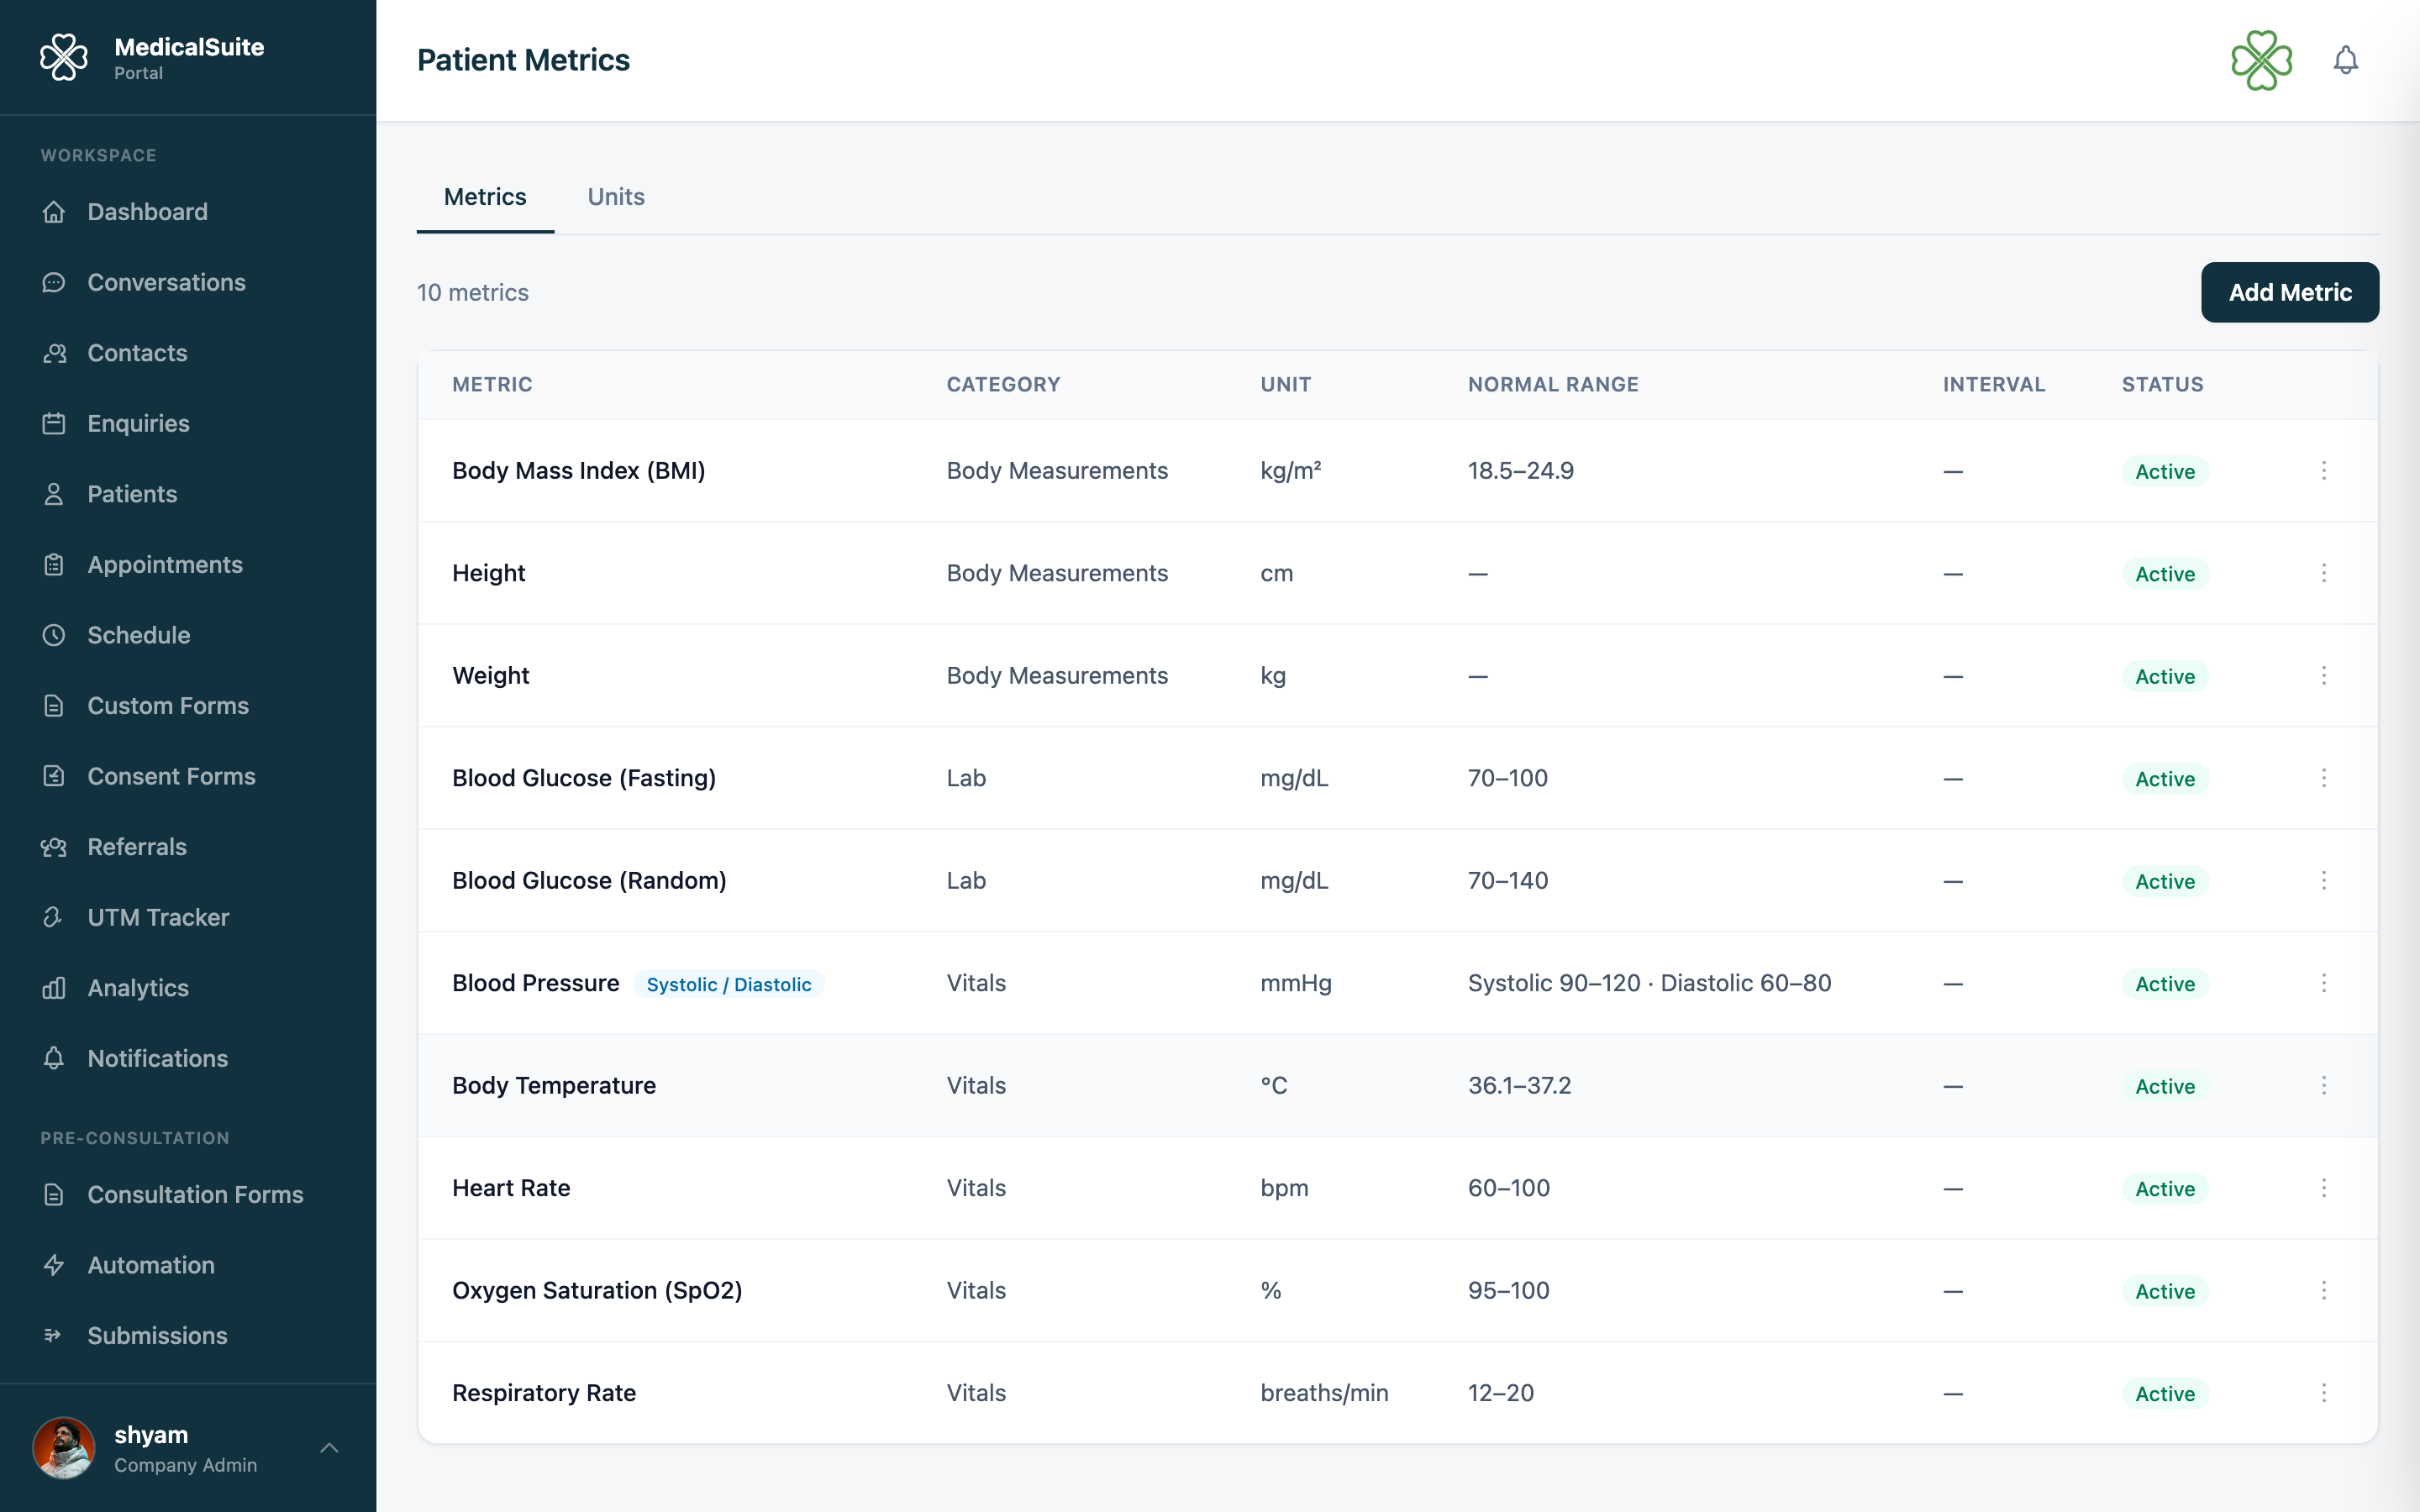
Before staff can record readings, an admin defines what your clinic measures, under Practice → Patient Metrics:
- Create your units (kg, mmHg, mmol/L…).
- Create your metrics — each metric has a name and its unit, e.g. "Weight (kg)", "Systolic BP (mmHg)". A metric can have multiple components (e.g. blood pressure = systolic + diastolic).
Do this once; every patient can then be tracked against these metrics.
Recording a reading
- Open the patient's record → Metrics section.
- Pick the metric (e.g. Weight).
- Enter the value and the date of the measurement.
- Save. The reading joins the patient's history instantly.
Reading the graphs
Each metric shows a trend graph of all readings. Two per-patient settings make the graph genuinely useful:
- Border levels — a healthy range for this patient (say, weight 70–80 kg). Readings outside the range stand out on the graph, so a drift in the wrong direction is visible at a glance.
- Measurement interval — how often a reading is expected (e.g. monthly). Helps you notice when a patient is overdue for a check.
Common questions
Entered a wrong value? Open the reading and correct it — the graph updates.
Can the doctor see these? Yes — doctors see metrics for their patients in their portal.
Different patients need different target ranges. Exactly why border levels are set per patient, not per metric.